Tidbits of Knowledge In the previous article, Basics of Vibration Analysis (1), octave analysis was explained. This time, we summarized FFT analysis, another typical frequency analysis method, in an easy-to-understand manner....
What is FFT Analysis?
The FFT in FFT analysis stands for Fast Fourier Transform.As you can see from the word “fast,” it is an efficient and fast method of performing a Fourier transform. So what is a Fourier transform? Actual sound and vibration can be thought of as a complex waveform made up of overlapping simple waveforms (sine waves of various frequencies) of different sizes. The Fourier transform is the process of dividing this complex waveform into simple waveforms and determining which frequency components are included and how much of each are included. The vibrations that actually appear in our daily lives have complex vibration waveforms on the time axis, as shown in Figure 1, which can be thought of as the sum of simple vibration waveforms. Figure 2 is the result of FFT transformation of the complex vibration waveform shown in Figure 1. The horizontal axis has been changed from the time axis to the frequency axis. FFT transformation of the complex vibration waveform shows that there are vibrations of 3 Hz, 9 Hz, and 20 Hz frequency components, with the 3 Hz component having the largest (amplitude) vibration.
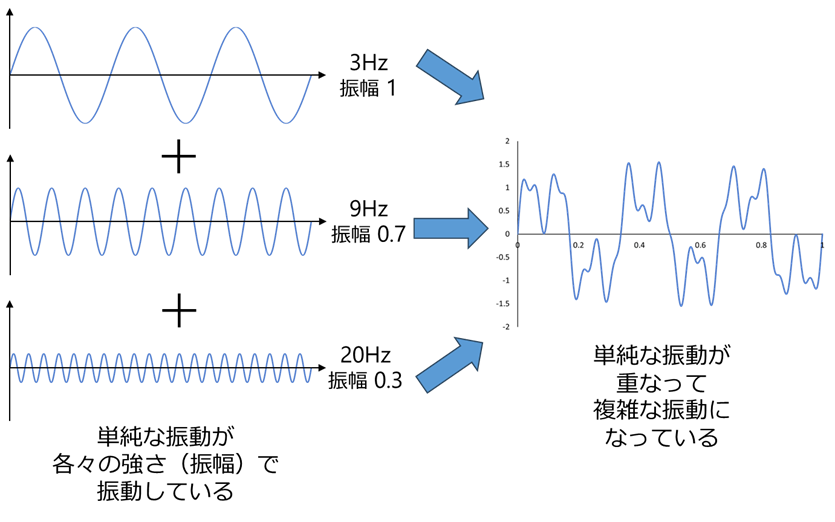
Figure 1 Complex vibration waveforms and their constituent vibration waveforms
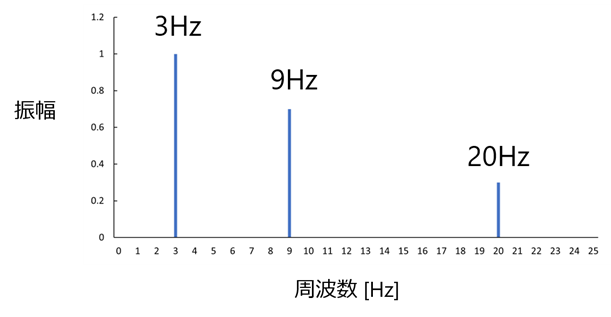
Figure 2 Graph of FFT-transformed frequencies of complex vibration waveforms
The concept of the Fourier transform can be summarized as shown in Figure 3. The image is that the vibration waveform viewed on the time axis is viewed on a different axis, the frequency axis side.
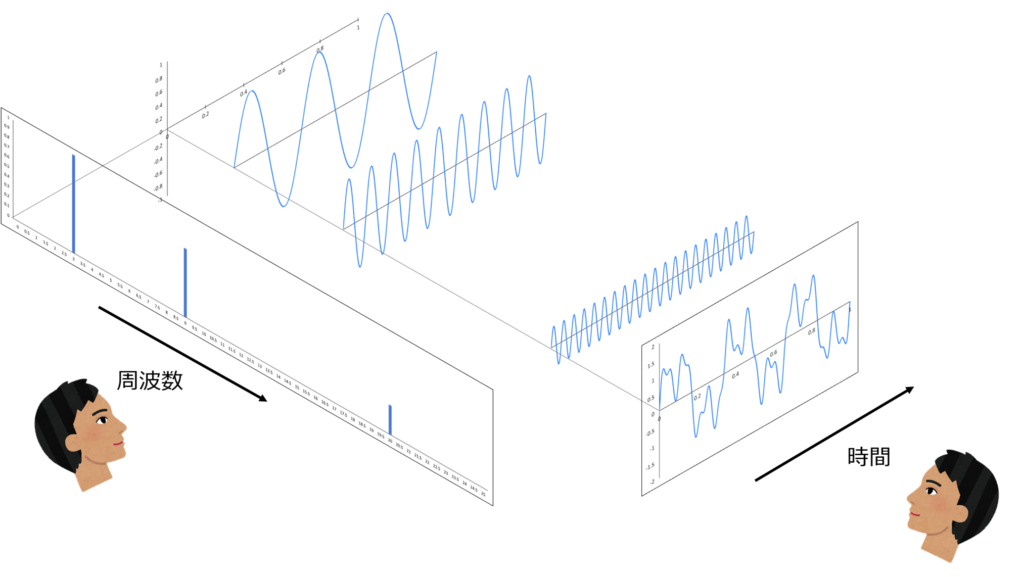
Figure 3 Conceptual diagram of Fourier transform
In octave analysis, the frequency axes are equally spaced at equal ratio intervals per octave, such as 31.5 Hz, 63 Hz, and 125 Hz, whereas in FFT analysis, the frequency axes are generally equally spaced and of a finer width. Therefore, FFT analysis provides a more detailed analysis of the frequency axis. For this reason, FFT analysis is used in cases such as natural frequency measurement and transfer coefficient measurement, where the difference in magnitude of each frequency needs to be examined in detail. It is also used to record the frequency and magnitude of vibrations generated on factory production lines, and when bearings or other components are damaged, it can be used to detect abnormal conditions such as changes in the frequency or magnitude of the vibration, or to determine when maintenance should be performed. Octave analysis, on the other hand, has larger frequency intervals, but it is an analysis method that fits well with human senses, so octave analysis is also often used in the field of sound.
Examples of actual vibration analysis
Here is an example where Yacmo actually measured the vibration and analyzed the FFT.
This is an example of how we addressed the problem of the floor shaking significantly due to walking in the office. Figure 4 shows the vibration waveform when a person is walking. Shaking of 2-3 cm/s2 in acceleration amplitude occurs. The gray line in Figure 5 is the result of FFT analysis (Fast Fourier Transform) of this waveform, which shows a peak at 7.5 Hz. 2 to 3 cm/s2 at 7.5 Hz is the magnitude of vibration that causes a slight fluffy feeling, and is thought to be the vibration component that the occupants were feeling. Since the natural frequency of the floor was also found to be 7.5 Hz in the preliminary investigation, it can be concluded that the large shaking that occurs when walking is caused by the floor resonance phenomenon. Therefore, in order to solve this problem, it is necessary to suppress the resonance amplification of the floor.
Therefore, we took measures to lower the 7.5 Hz component using the AMD vibration control device (click here for details). The blue line in Figure 5 shows the result after the countermeasure. The sharp 7.5 Hz peak (gray line) before the countermeasure is gone. Figure 6 shows the vibration waveform when walking, which indicates that the acceleration was reduced to 0.5 cm/s2 and the floor sway was reduced to 1/4.
For vibration control measures such as AMD, it is important to know the peak frequency and resonance frequency more accurately, so FFT analysis, which allows detailed frequency analysis, is effective.
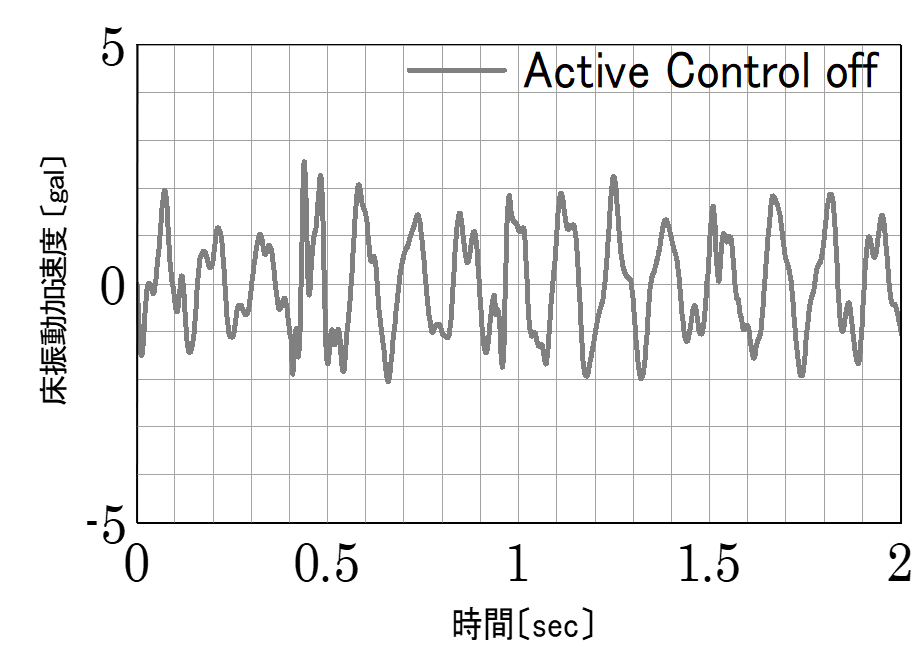
Figure 4 Vibration waveform before countermeasures
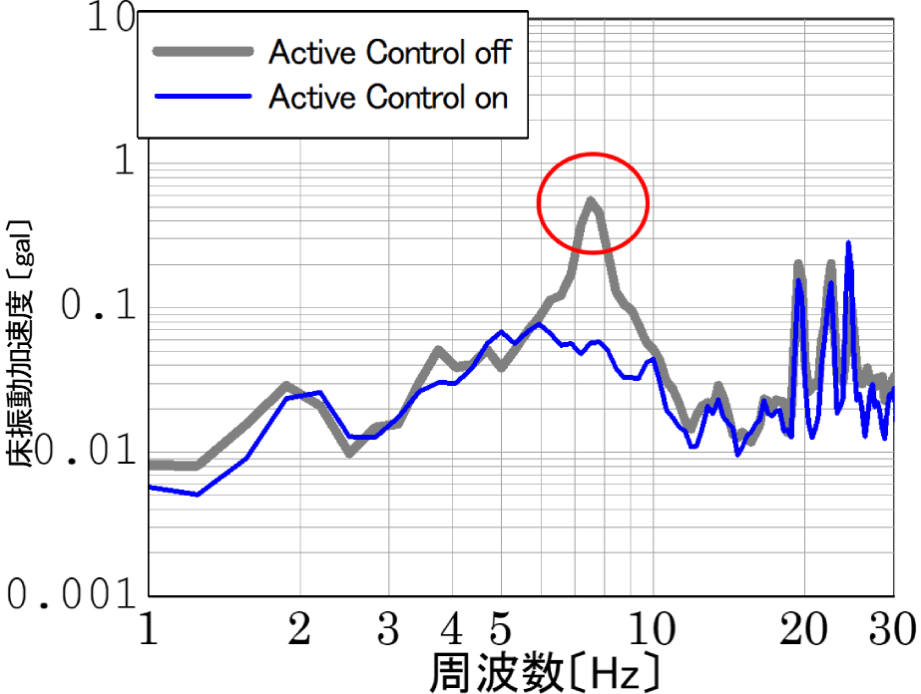
Figure 5 Result of frequency analysis
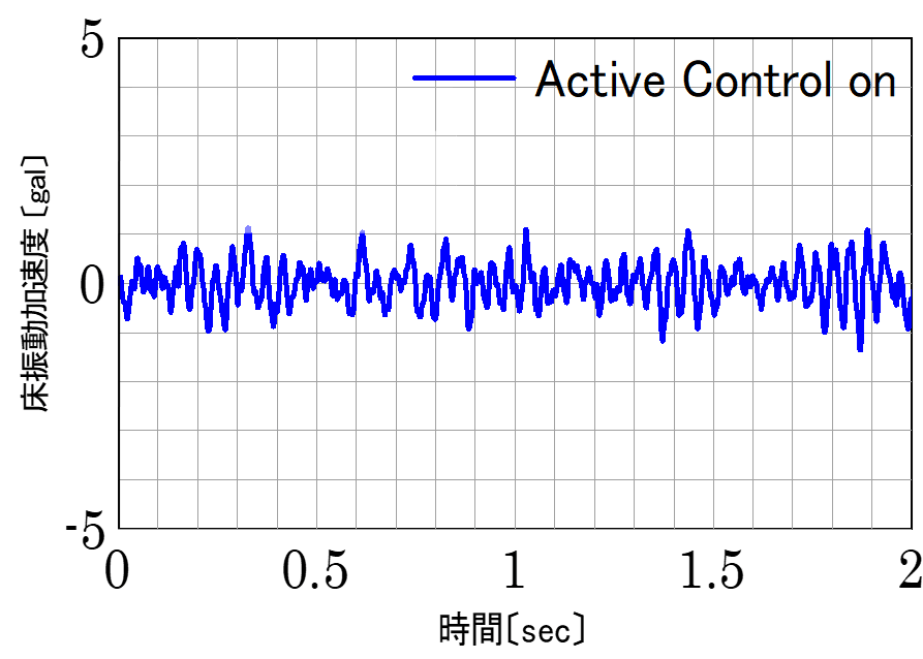
Figure 6 Vibration waveform after countermeasures
